Axonator is a platform that provides a report builder tool that allows you to create custom reports for your company using the most comprehensive and flexible analytics tool. You can pick the type, metrics, brand style as per your needs and decide how data should be displayed. You can add beautiful charts, graphs, and images to bring your reports to life.
A Step-by-Step Guide to Using the Axonator Report Builder
Axonator has a visual report builder that allows users to create custom reports and dashboards. With this feature, you can monitor and analyze data using charts, tables, and graphs to gain insights into your business performance. The report builder is a no-code tool that enables users to create digital reports without any programming knowledge. The user interface is simple and intuitive, with drag-and-drop functionality that makes it easy to add, remove, and reposition elements to create customized reports that meet specific business needs.
In addition to creating reports, Axonator also allows users to schedule report generation and distribution. This means that you can automate the process of creating and sharing reports, saving time and increasing efficiency. Overall, the report builder in Axonator is a powerful tool that helps organizations track, monitor, and analyze data to improve performance and make informed business decisions.
However, perhaps the most striking feature of this function is its enormous ease of use. In other words, it is not necessary to have great technological knowledge to carry it out. Let's take a look at some simple steps to perform the task.
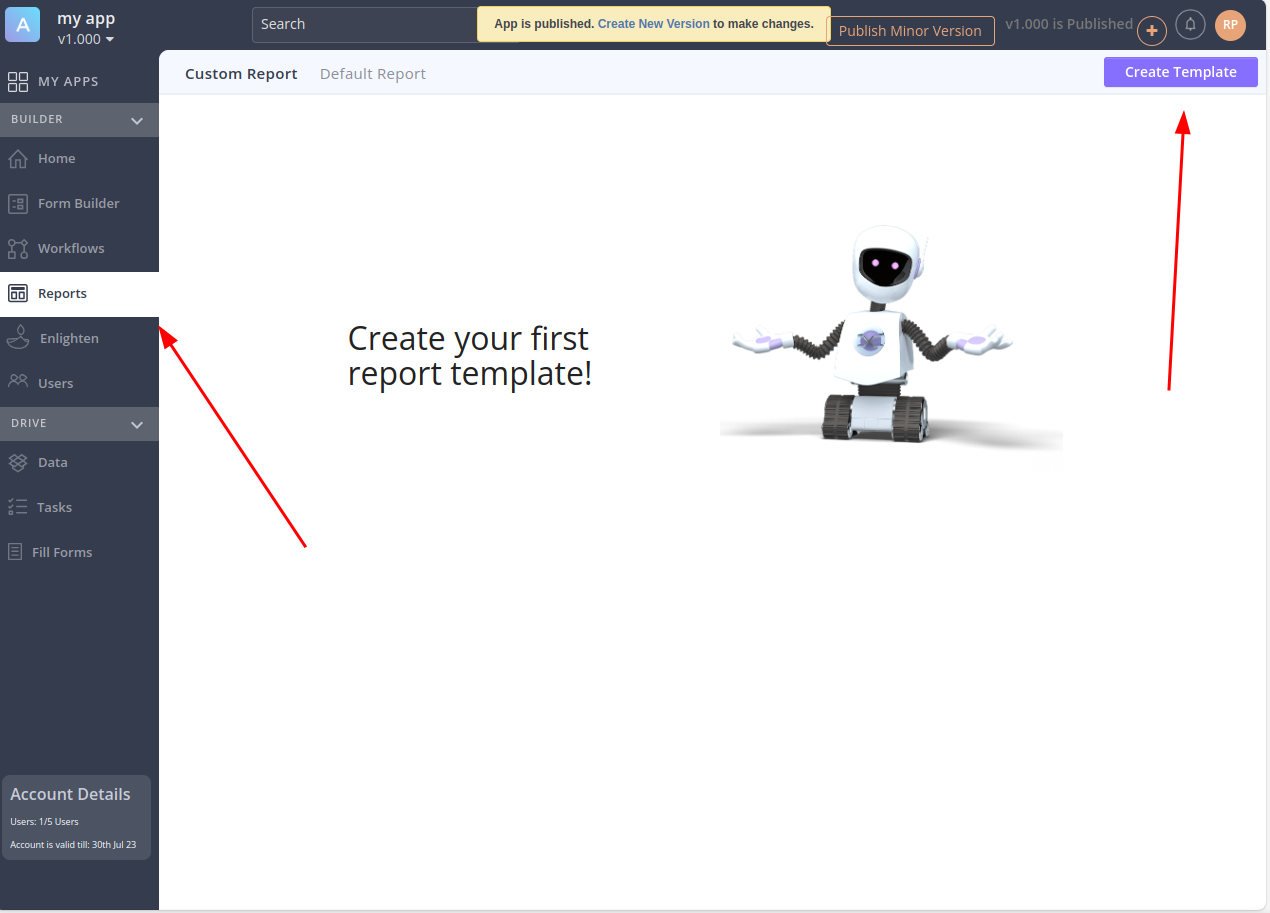
The first thing you have to do is to create the report template. With this in mind, click on Reports in the dashboard. Next, click on Create template.
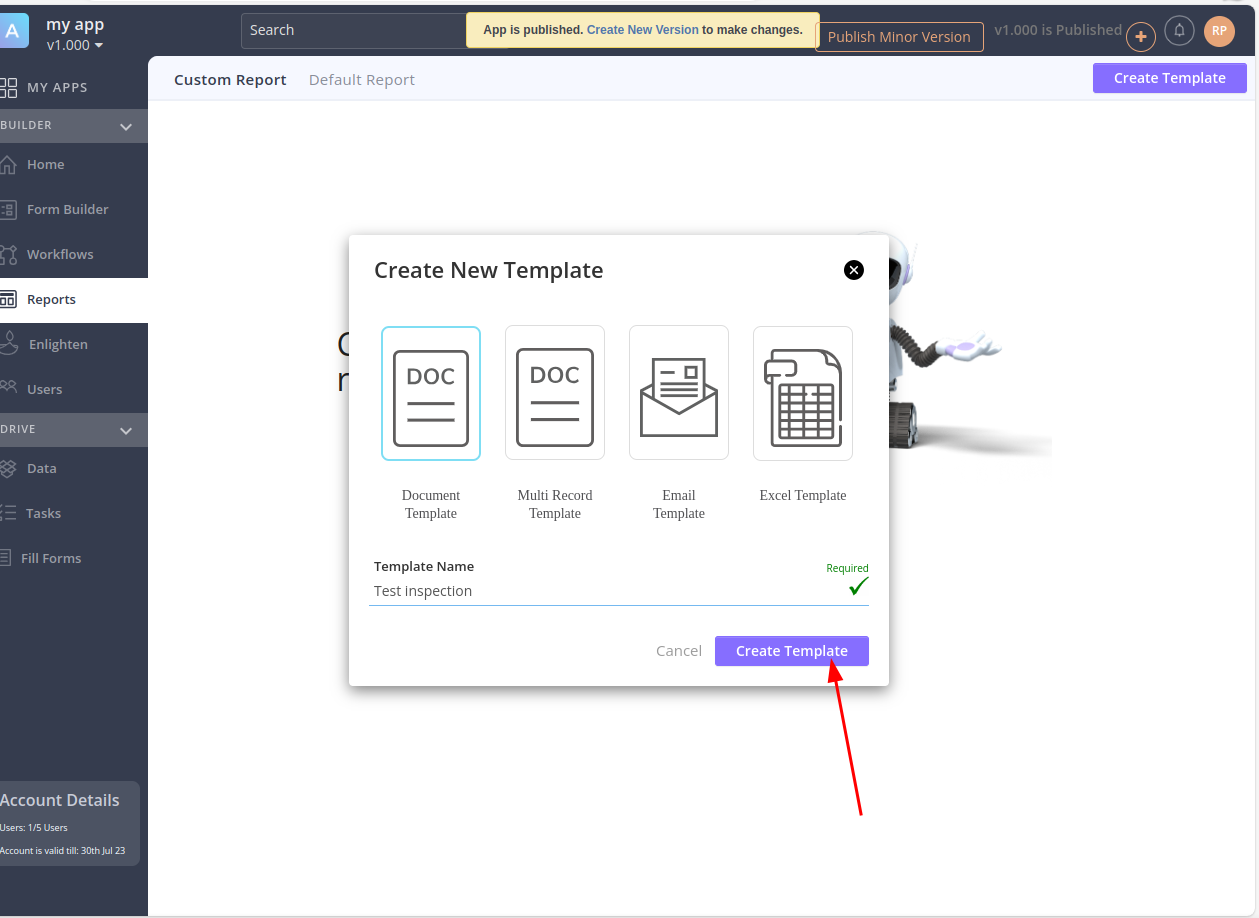
Next, select the type of template to be created. When we are ready, just click on Create template.
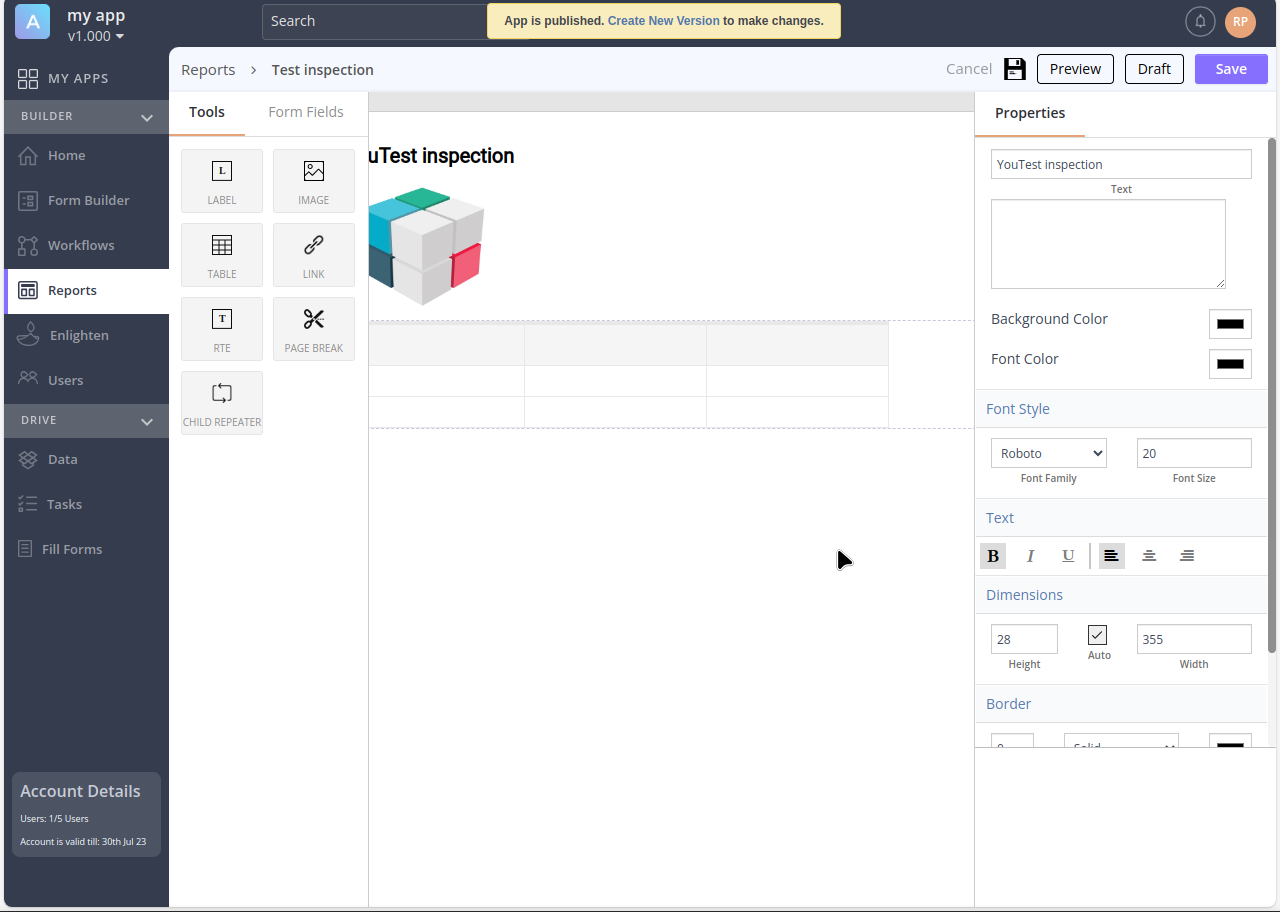
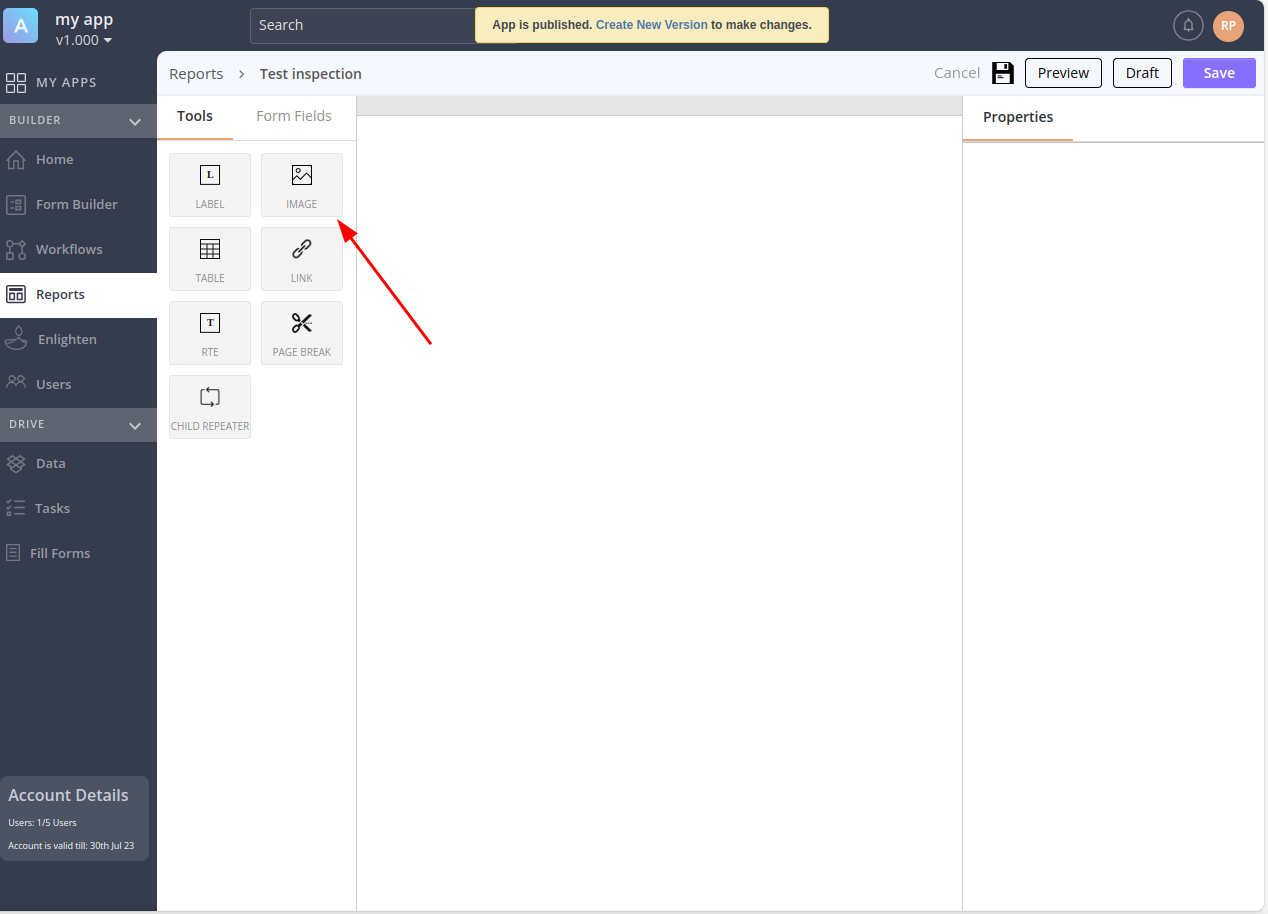
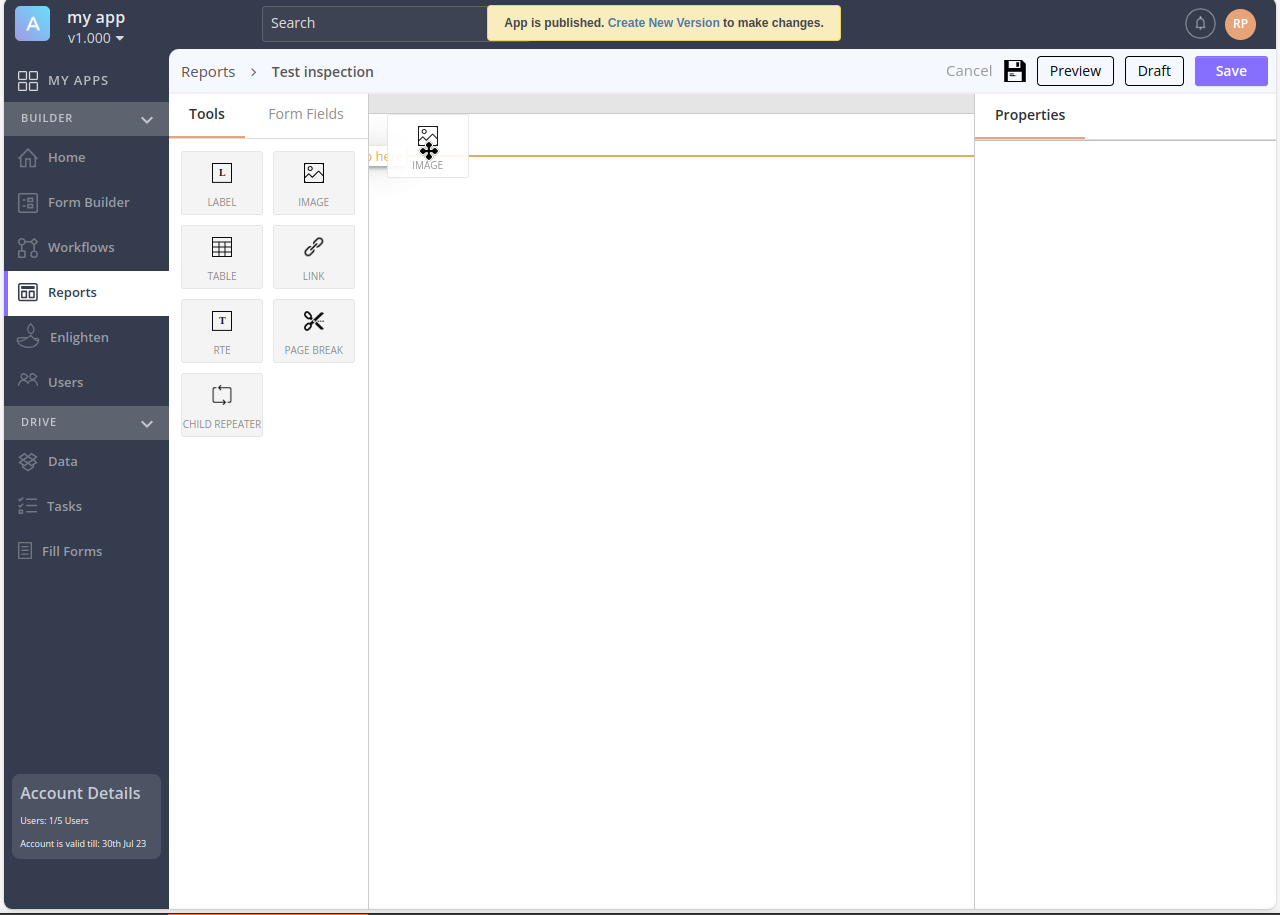
You will be immediately redirected to the creation panel. This time, we will select the images section. As in previous examples, we will be able to drag the elements to the place where we want to add them.
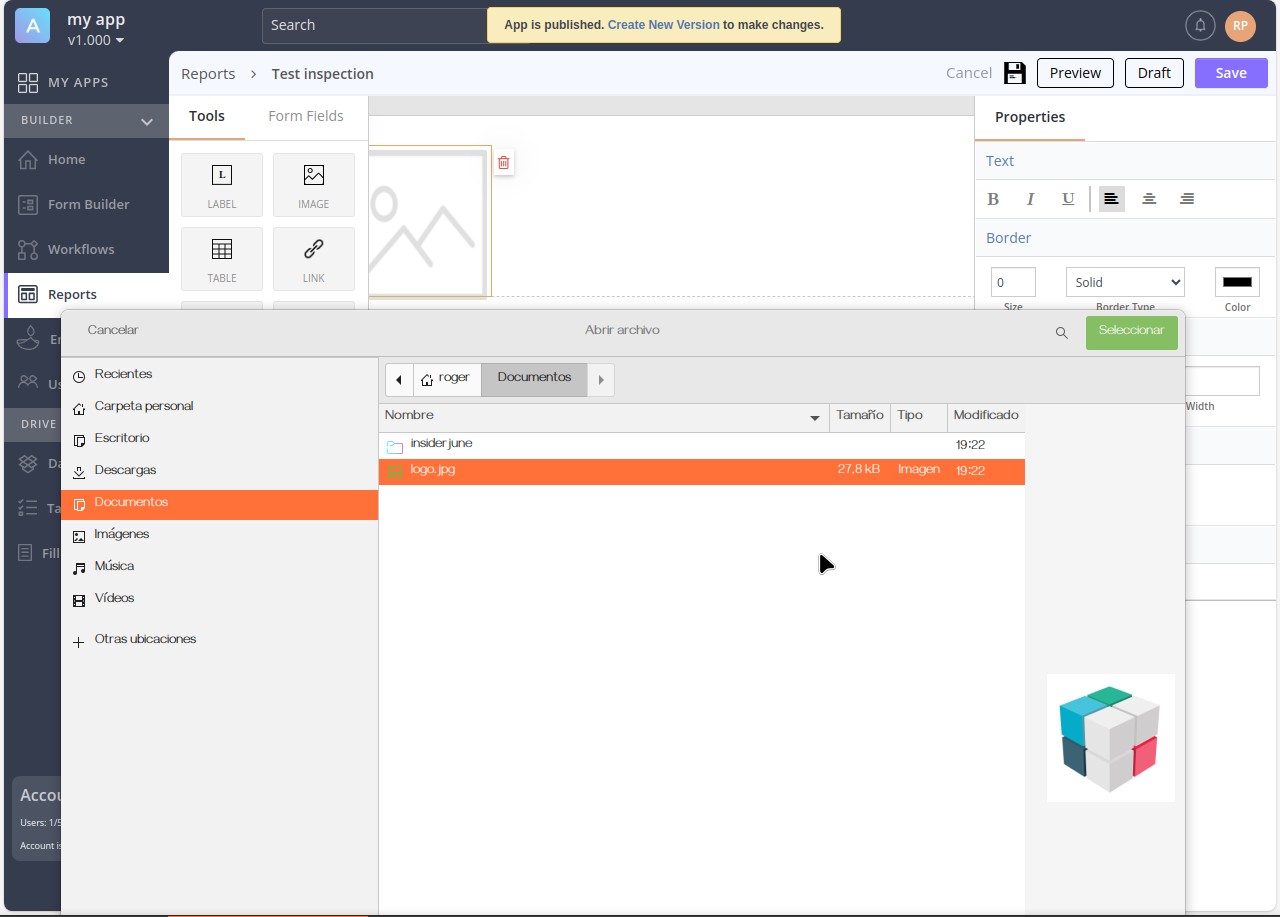
By clicking on the newly added item, you can customize it by adding an image of your choice. For example, the logo of our company.
Next, you must add the name to the newly created element.
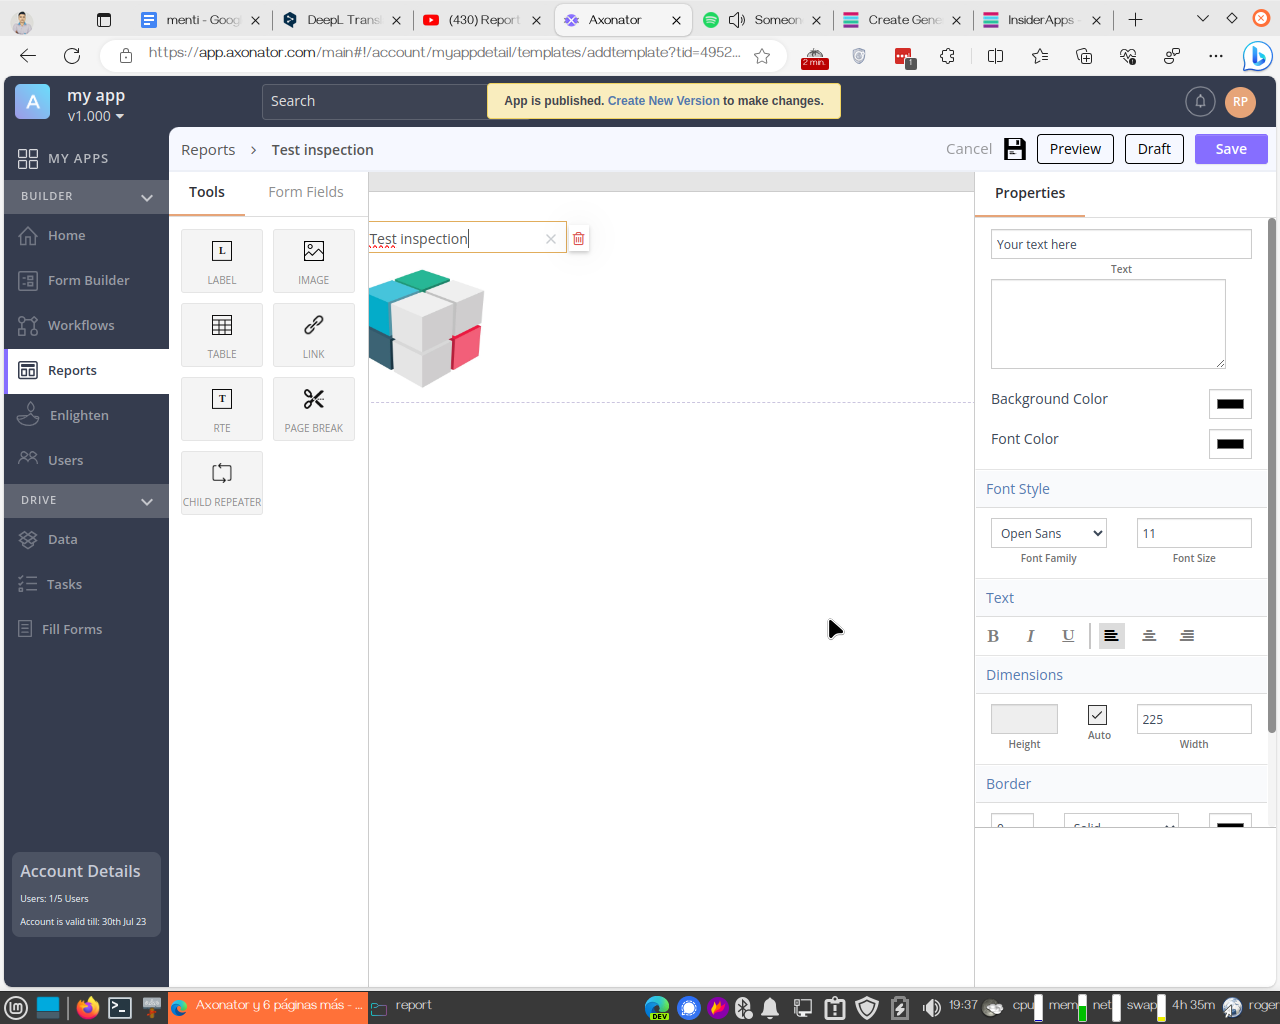
Finally, you can select and drag as many elements as necessary to complete the report. For example, a column.